- EUR/USD may depreciate further as the short-term price momentum is weaker.
- The initial support appears at its two-year low of 1.0332, recorded on November 22.
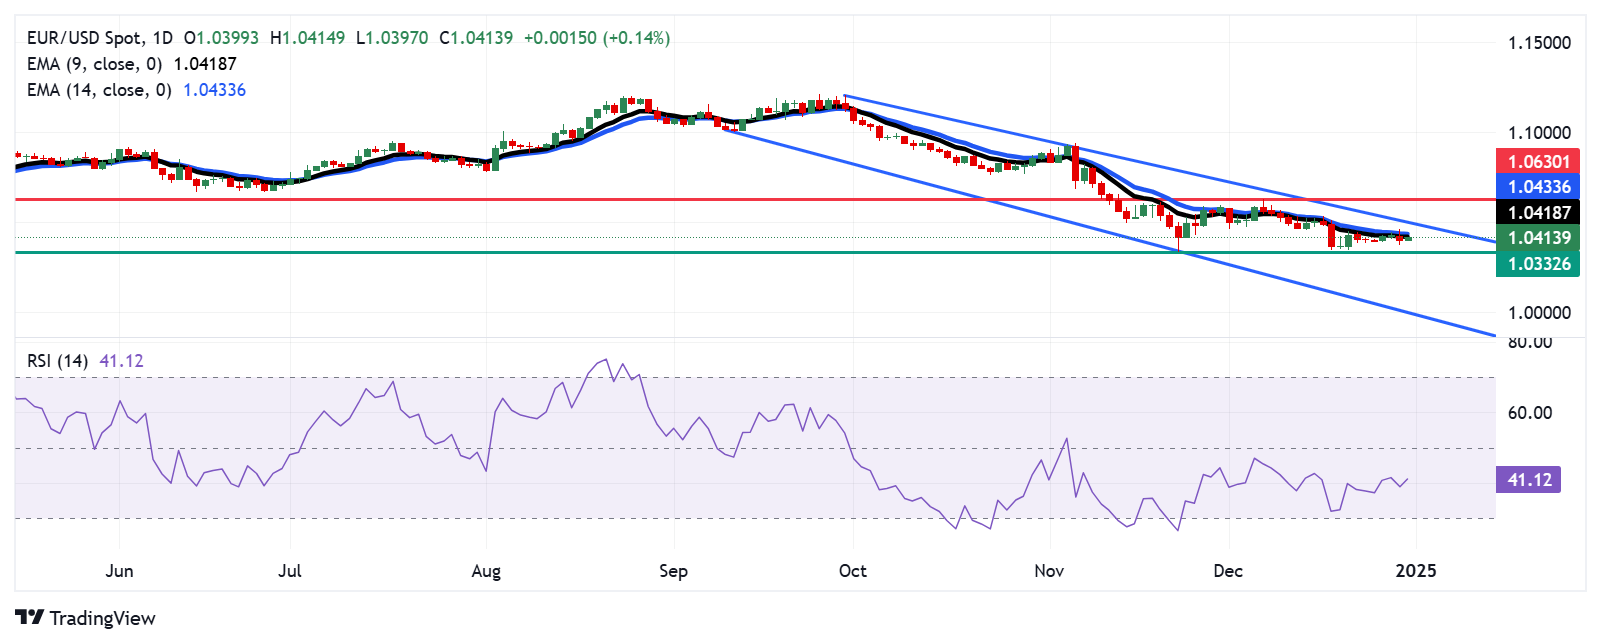
- The nine-day EMA acts as immediate resistance at the 1.0417 level.
EUR/USD recovers its recent losses from the previous session, trading around 1.0410 during the European hours on Tuesday. A review of the daily chart shows an ongoing bearish bias as the pair is confined within a descending channel pattern.
The 14-day Relative Strength Index (RSI), a key momentum indicator, remains below the 50 level, confirming the persistent bearish sentiment for the EUR/USD pair. Additionally, the nine-day Exponential Moving Average (EMA) is below the 14-day EMA, suggesting the short-term price momentum is weaker.
On the downside, the two-year low at 1.0332, which was recorded on November 22, appears as a primary support for the EUR/USD pair. A successful break below this level could reinforce the bearish bias and put downward pressure on the pair to navigate the area around the lower boundary of the descending channel at the 1.0010 level.
In terms of resistance, the EUR/USD pair tests an immediate barrier at the nine-day Exponential Moving Average (EMA) of the 1.0417 level, followed by the 14-day EMA at the 1.0433 level. A breakthrough above these EMAs could lead the pair to approach the descending channel’s upper boundary at 1.0500, followed by its seven-week high of 1.0630 level.
EUR/USD: Daily Chart
Euro PRICE Today
The table below shows the percentage change of Euro (EUR) against listed major currencies today. Euro was the strongest against the New Zealand Dollar.
| USD | EUR | GBP | JPY | CAD | AUD | NZD | CHF | |
|---|---|---|---|---|---|---|---|---|
| USD | -0.15% | -0.04% | -0.42% | 0.09% | 0.13% | 0.23% | -0.12% | |
| EUR | 0.15% | 0.12% | -0.23% | 0.25% | 0.28% | 0.39% | 0.03% | |
| GBP | 0.04% | -0.12% | -0.39% | 0.12% | 0.17% | 0.28% | -0.09% | |
| JPY | 0.42% | 0.23% | 0.39% | 0.54% | 0.56% | 0.65% | 0.33% | |
| CAD | -0.09% | -0.25% | -0.12% | -0.54% | 0.03% | 0.14% | -0.22% | |
| AUD | -0.13% | -0.28% | -0.17% | -0.56% | -0.03% | 0.10% | -0.25% | |
| NZD | -0.23% | -0.39% | -0.28% | -0.65% | -0.14% | -0.10% | -0.35% | |
| CHF | 0.12% | -0.03% | 0.09% | -0.33% | 0.22% | 0.25% | 0.35% |
The heat map shows percentage changes of major currencies against each other. The base currency is picked from the left column, while the quote currency is picked from the top row. For example, if you pick the Euro from the left column and move along the horizontal line to the US Dollar, the percentage change displayed in the box will represent EUR (base)/USD (quote).
Information on these pages contains forward-looking statements that involve risks and uncertainties. Markets and instruments profiled on this page are for informational purposes only and should not in any way come across as a recommendation to buy or sell in these assets. You should do your own thorough research before making any investment decisions. FXStreet does not in any way guarantee that this information is free from mistakes, errors, or material misstatements. It also does not guarantee that this information is of a timely nature. Investing in Open Markets involves a great deal of risk, including the loss of all or a portion of your investment, as well as emotional distress. All risks, losses and costs associated with investing, including total loss of principal, are your responsibility. The views and opinions expressed in this article are those of the authors and do not necessarily reflect the official policy or position of FXStreet nor its advertisers. The author will not be held responsible for information that is found at the end of links posted on this page.
If not otherwise explicitly mentioned in the body of the article, at the time of writing, the author has no position in any stock mentioned in this article and no business relationship with any company mentioned. The author has not received compensation for writing this article, other than from FXStreet.
FXStreet and the author do not provide personalized recommendations. The author makes no representations as to the accuracy, completeness, or suitability of this information. FXStreet and the author will not be liable for any errors, omissions or any losses, injuries or damages arising from this information and its display or use. Errors and omissions excepted.
The author and FXStreet are not registered investment advisors and nothing in this article is intended to be investment advice.
Recommended content
Editors’ Picks

EUR/USD extends slide toward 1.0300, touches new two-year low
EUR/USD stays under bearish pressure and trades at its lowest level since December 2022 below 1.0350 on Thursday. The pair turned south amid a resurgent US Dollar demand and worsening market mood. Investors stay cautious at the onset of 2025, awaiting the US jobs data for fresh incentives.

GBP/USD slumps to multi-month lows below 1.2450
Following an earlier recovery attempt, GBP/USD reversed its direction and declined to its weakest level in nearly eight months below 1.2450. The renewed US Dollar (USD) strength on worsening risk mood weighs on the pair as markets await mid-tier data releases.

Gold benefits from risk aversion, climbs above $2,640
Gold gathers recovery momentum and trades at a two-week-high above $2,640 heading into the American session on Thursday. The precious metal benefits from the sour market mood and the pullback seen in the US Treasury bond yields.

XRP rockets 11% as Bitcoin starts New Year with bullish bang
Crypto majors zoomed higher in the past 24 hours as the market entered a widely expected bullish year, with Bitcoin inching above $95,000 to shake off losses from last week. XRP surged 11% to lead growth among majors as of Thursday, led by $1.3 billion worth of trading volumes on Korea-focused exchange UpBit.

Three Fundamentals: Year-end flows, Jobless Claims and ISM Manufacturing PMI stand out Premium
Money managers may adjust their portfolios ahead of the year-end. Weekly US Jobless Claims serve as the first meaningful release in 2025. The ISM Manufacturing PMI provides an initial indication ahead of Nonfarm Payrolls.

Best Forex Brokers with Low Spreads
VERIFIED Low spreads are crucial for reducing trading costs. Explore top Forex brokers offering competitive spreads and high leverage. Compare options for EUR/USD, GBP/USD, USD/JPY, and Gold.