On July 19, the largest IT outage in history occurred, causing the stock prices of Microsoft and CrowdStrike to nosedive.
But was this event a disaster or a golden ticket for traders?
You may have already done some stock analysis.
And many traders dive into W.D. Gann’s methods only to end up more confused.
Deciphering which planets to focus on, predicting trends, and aligning charts can be overwhelming.
However, Astro trading, when done right, can add another layer of precision to your trades.
In this post, you'll learn how to draw Astro Trendline step by step:
- How to identify significant planetary alignments.
- Methods to plot price action for clear trends.
- Connect the Dots.
- Drawing accurate astro-trendlines.
- Mastering timing and precision with astro-trendlines.
Stay tuned as we break down each step, making the complex world of Astro Trading simple and actionable.
Step 1: Identify significant planetary alignments
Ever felt like you’re always just a step behind the curve? Knowing when the market is about to turn is crucial. To master this, start by identifying those key planetary alignments.
Pay attention to hard aspects
Here's a game-changer: hard aspects of major planets often coincide with important turning points in financial markets.
Tips:
- Keep a calendar of major planetary movements.
- Don’t waste money on expensive Astro software; use your ephemeris.
- Monitor major planets like Jupiter, Saturn, Mars, and Venus.
Step 2: Plot price action for clear trends
Now that you know when these alignments happen, the next step is to see how price action behaves.
Find significant highs and lows
These highs and lows define the trend you’re looking at. They are your first clues.
Example:
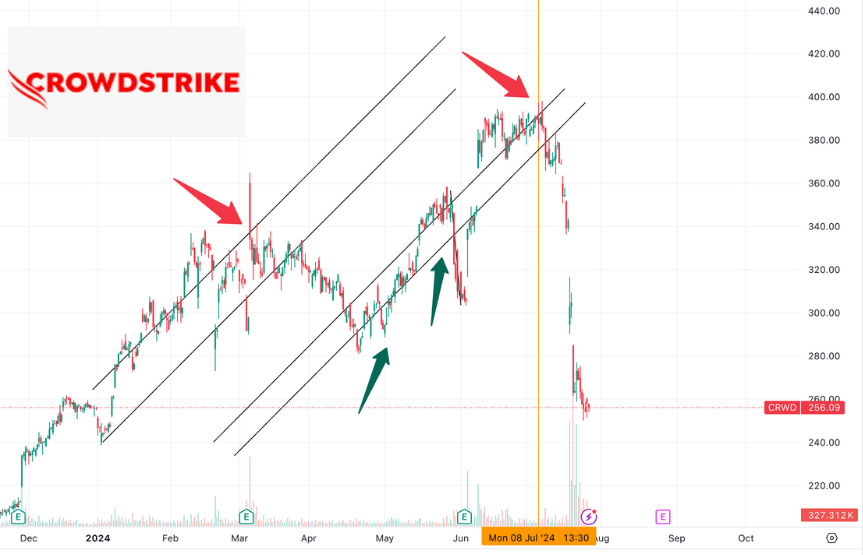
Think of the times CrowdStrike's stock dropped suddenly. If you look back at the periods when highs were formed, you might notice a pattern related to planetary alignments.
Step 3: Connect the Dots
The cool part about this method is seeing how planetary alignments match with market extremes. These are your astro "anchor points."
Feeling more confident? You should. Astro trading might seem complex, but it breaks down into easy steps.
By knowing planetary alignments, plotting price action, and aligning them, you create a clear picture of market behavior.
Next up: We'll explore how to draw these astro-trendlines and nail down timing for better market entry.
Step 4: Draw the astro-trendline
Start with a baseline: Draw a line from one planetary anchor point to the next. This represents your Astro-trendline.
Check for Consistency: Make sure this line connects key highs and lows. That’s your Astro-trendline at work.
CrowdStrike was listed in 2019. The best part is that you don’t need a long data history for back-testing. You can do this in less than 30 minutes.
That’s your astro-trendline at work.
Step 5: Mastering timing and precision with astro-trendlines
Timing can make or break your trades. Here’s how to get it right with astro-trendlines.
Mathematical trading methods can add another layer of precision to your astro-trendline analysis.
This gives you a clearer perspective on discerning the trend, allows for more precise market entries, and improves accuracy.
Example:
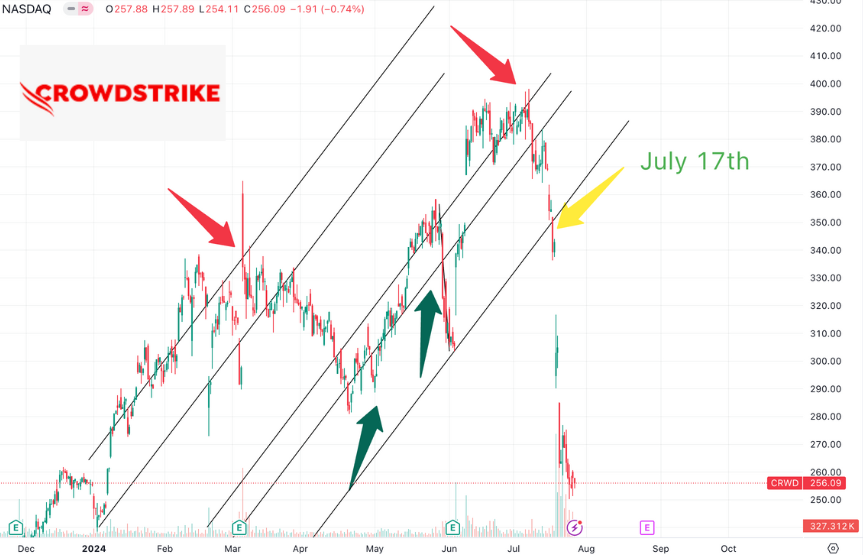
When CrowdStrike experienced a major dip and broke the Astro-trendline,
WD Gann’s mathematics gives you more accurate points to exit or short-sell the stock 2 days before the crash on July 19th.
Recap
- Start by identifying significant planetary alignments.
- Plot the price action and align these celestial events.
- Draw and validate your astro-trendline.
- Combine this with Gann mathematics for precise entry and exit points.
Final thought:
Astro trading takes practice, but the returns can be worthwhile.
It adds a unique layer of insight that you won’t get from any conventional technical indicators.
Khit Wong and all members of Gann Explained LLC are NOT financial advisors, and nothing they say is meant to be a recommendation to buy or sell any financial instrument. All information is strictly educational and/or opinion. By reading this, you agree to all of the following: You understand this to be an expression of opinions and not professional advice. Any opinions, news, research, analysis, prices, or other information contained on this website is provided as general market commentary and education and does not constitute advice. The brand name of Gann Explained LLC will not accept liability for any loss or damage, including without limitation any loss of profit, which may arise directly or indirectly from the use of or reliance on such information. You are solely responsible for the use of any content and hold Khit Wong, Gann Explained LLC all members harmless in any event or claim. FTC DISCLOSURE: Any income claims shared by myself, students, friends, or clients are understood to be true and accurate but are not verified in any way. Always do your own due diligence and use your own judgment when making buying decisions and investments in your business.
Editors’ Picks

EUR/USD extends slide toward 1.0300, touches new two-year low
EUR/USD stays under bearish pressure and trades at its lowest level since December 2022 below 1.0350 on Thursday. The pair turned south amid a resurgent US Dollar demand and worsening market mood. Investors stay cautious at the onset of 2025, awaiting the US jobs data for fresh incentives.

GBP/USD slumps to multi-month lows below 1.2450
Following an earlier recovery attempt, GBP/USD reversed its direction and declined to its weakest level in nearly eight months below 1.2450. The renewed US Dollar (USD) strength on worsening risk mood weighs on the pair as markets await mid-tier data releases.

USD/JPY drops to test 157.00 amid thin trading
USD/JPY turns south to test 157.00 in Thursday's Asian trading, erasing early gains. The pair loses traction as risk sentiment deteriorates on bleak Chinese PMI data and revives the safe-haven demand for the Japanese Yen. Thin liquidity conditions also exaggerate USD/JPY moves as Japan is on holiday.
Editors’ Picks
EUR/USD extends slide toward 1.0300, touches new two-year low
EUR/USD stays under bearish pressure and trades at its lowest level since December 2022 below 1.0350 on Thursday. The pair turned south amid a resurgent US Dollar demand and worsening market mood. Investors stay cautious at the onset of 2025, awaiting the US jobs data for fresh incentives.
GBP/USD slumps to multi-month lows below 1.2450
Following an earlier recovery attempt, GBP/USD reversed its direction and declined to its weakest level in nearly eight months below 1.2450. The renewed US Dollar (USD) strength on worsening risk mood weighs on the pair as markets await mid-tier data releases.

Gold benefits from risk aversion, climbs above $2,640
Gold gathers recovery momentum and trades at a two-week-high above $2,640 heading into the American session on Thursday. The precious metal benefits from the sour market mood and the pullback seen in the US Treasury bond yields.

XRP rockets 11% as Bitcoin starts New Year with bullish bang
Crypto majors zoomed higher in the past 24 hours as the market entered a widely expected bullish year, with Bitcoin inching above $95,000 to shake off losses from last week. XRP surged 11% to lead growth among majors as of Thursday, led by $1.3 billion worth of trading volumes on Korea-focused exchange UpBit.

Three Fundamentals: Year-end flows, Jobless Claims and ISM Manufacturing PMI stand out Premium
Money managers may adjust their portfolios ahead of the year-end. Weekly US Jobless Claims serve as the first meaningful release in 2025. The ISM Manufacturing PMI provides an initial indication ahead of Nonfarm Payrolls.
RECOMMENDED LESSONS
Making money in forex is easy if you know how the bankers trade!
Discover how to make money in forex is easy if you know how the bankers trade!
5 Forex News Events You Need To Know
In the fast moving world of currency markets, it is extremely important for new traders to know the list of important forex news...
Top 10 Chart Patterns Every Trader Should Know
Chart patterns are one of the most effective trading tools for a trader. They are pure price-action, and form on the basis of underlying buying and...
7 Ways to Avoid Forex Scams
The forex industry is recently seeing more and more scams. Here are 7 ways to avoid losing your money in such scams: Forex scams are becoming frequent. Michael Greenberg reports on luxurious expenses, including a submarine bought from the money taken from forex traders. Here’s another report of a forex fraud. So, how can we avoid falling in such forex scams?
What Are the 10 Fatal Mistakes Traders Make
Trading is exciting. Trading is hard. Trading is extremely hard. Some say that it takes more than 10,000 hours to master. Others believe that trading is the way to quick riches. They might be both wrong. What is important to know that no matter how experienced you are, mistakes will be part of the trading process.

Best Forex Brokers with Low Spreads
VERIFIED Low spreads are crucial for reducing trading costs. Explore top Forex brokers offering competitive spreads and high leverage. Compare options for EUR/USD, GBP/USD, USD/JPY, and Gold.