![]() Littlefish FX Analysts
Littlefish FX Analysts
Littlefish FX
It’s time to take a look at Bollinger bands. And no, unfortunately, it’s nothing to do with champagne.
Bollinger bands are a technical analysis tool invented by John Bollinger. (Who also wrote the imaginatively titled book Bollinger on Bollinger Bands). Basically, they work by measuring the “highness” or “lowness” of a price, compared to previous trades.
They’re made up of a moving average with upper and lower bands based on standard deviations.
FOR EXAMPLE…
A common setting for a Bollinger band is a 20 period moving average with the upper and lower bands set at 2 standard deviations.
Why Use Standard Deviations?
Standard deviations can be used to gives you an idea of how much the price you are looking at varies from the average over a period of time.
In a totally random set of results, you would expect to see 95% of all results falling within 2 standard deviations, and more than 99% to be within 3. So applying this to trading, IF price is completely random, then there’s a very good chance that the next price the market makes will fall somewhere between the upper and lower Bollinger bands.
Of course, this all depends on price being random, and whether this is true or not is an argument for another day. However, even if price is not random, Bollinger bands are still useful to provide an indication of how far price is likely to move in a certain period.
How To Make Bollinger Bands Work For You
Bollinger bands can be applied to both trending and non-trending markets using a slightly different strategy for each environment. Let’s take a look at both, and the best ways to analyse them…
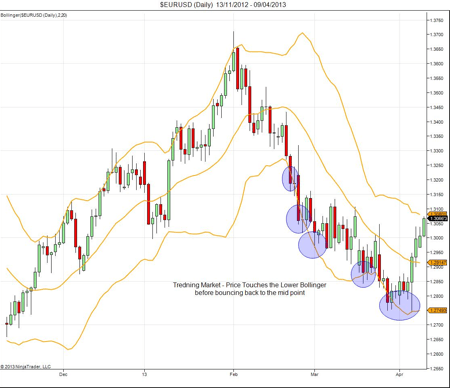
1. Trending Markets
In a trending market, price will be pushing in a particular direction, pushing on either the upper or lower Bollinger band, depending what direction it’s moving in.
This is shown in the chart below:
HOW TO DO IT:
In a trending market, the best way to use Bollinger bands is through the pull back strategy.
Bollinger bands can allow you to use a pull back towards the moving average to enter into the direction of the trend.
WHY IT’S USEFUL:
Using Bollinger bands in this way allows you to run tight stops, in order to capture the trend.
DON’T FORGET:
This works particularly well on lower time frames. When used with good risk/reward management, it can be a really good strategy for use on highly traded pairs (like the EURUSD).
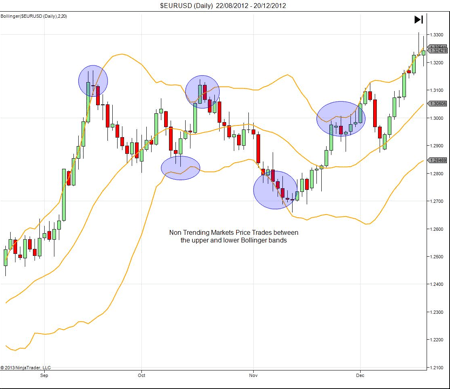
2. Non-Trending Markets
In a non-trending market (also known as range bound or choppy), Bollinger bands can act as barriers to price, as shown in the chart:
HOW TO DO IT:
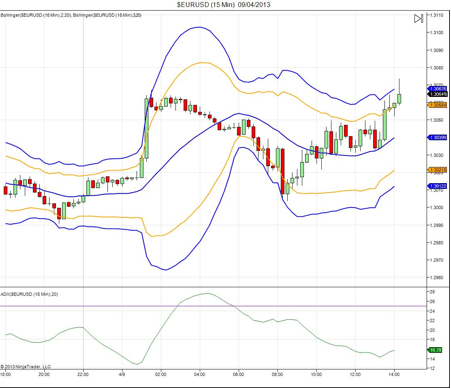
In a range bound or low volatility environments, you need to use Bollinger bands as a guide to how the price may move. You can do this using the fading strategy.
To do this, you need to look for an extreme price movement in low volatility, and then take the opposite position. Then, plot the 20 period moving average, and the 2 and 3 standard deviations on the chart, as shown below:
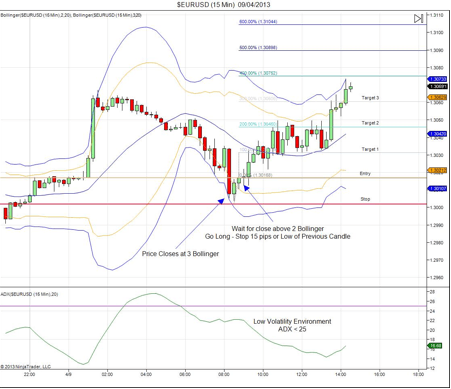
The final step is to look for the price to hit the outer Bollinger, then move back into the Bollinger range. It if breaks or closes above the inner Bollinger, you can then get in the direction towards the moving average.
Here’s an example of what might happen:
WHY IT’S USEFUL:
This strategy allows you to use relatively tights stops on lower time frames to capture a fade in the opposite direction.
DON’T FORGET:
To make sure you’re in a low volatility environment before using this strategy. (You can do this using ADX or an Awsome Oscilator, or get clues from your moving averages or MACD).
All comments, charts and analysis on this website are purely provided to demonstrate our own personal thoughts and views of the market and should in no way be treated as recommendations or advice. Please do not trade based solely on any information provided within this site, always do your own analysis.
Editors’ Picks

EUR/USD extends slide toward 1.0300, touches new two-year low
EUR/USD stays under bearish pressure and trades at its lowest level since December 2022 below 1.0350 on Thursday. The pair turned south amid a resurgent US Dollar demand and worsening market mood. Investors stay cautious at the onset of 2025, awaiting the US jobs data for fresh incentives.
GBP/USD slumps to multi-month lows below 1.2450
Following an earlier recovery attempt, GBP/USD reversed its direction and declined to its weakest level in nearly eight months below 1.2450. The renewed US Dollar (USD) strength on worsening risk mood weighs on the pair as markets await mid-tier data releases.

USD/JPY drops to test 157.00 amid thin trading
USD/JPY turns south to test 157.00 in Thursday's Asian trading, erasing early gains. The pair loses traction as risk sentiment deteriorates on bleak Chinese PMI data and revives the safe-haven demand for the Japanese Yen. Thin liquidity conditions also exaggerate USD/JPY moves as Japan is on holiday.
Editors’ Picks

EUR/USD extends slide toward 1.0300, touches new two-year low
EUR/USD stays under bearish pressure and trades at its lowest level since December 2022 below 1.0350 on Thursday. The pair turned south amid a resurgent US Dollar demand and worsening market mood. Investors stay cautious at the onset of 2025, awaiting the US jobs data for fresh incentives.

GBP/USD slumps to multi-month lows below 1.2450
Following an earlier recovery attempt, GBP/USD reversed its direction and declined to its weakest level in nearly eight months below 1.2450. The renewed US Dollar (USD) strength on worsening risk mood weighs on the pair as markets await mid-tier data releases.

Gold benefits from risk aversion, climbs above $2,640
Gold gathers recovery momentum and trades at a two-week-high above $2,640 heading into the American session on Thursday. The precious metal benefits from the sour market mood and the pullback seen in the US Treasury bond yields.

XRP rockets 11% as Bitcoin starts New Year with bullish bang
Crypto majors zoomed higher in the past 24 hours as the market entered a widely expected bullish year, with Bitcoin inching above $95,000 to shake off losses from last week. XRP surged 11% to lead growth among majors as of Thursday, led by $1.3 billion worth of trading volumes on Korea-focused exchange UpBit.

Three Fundamentals: Year-end flows, Jobless Claims and ISM Manufacturing PMI stand out Premium
Money managers may adjust their portfolios ahead of the year-end. Weekly US Jobless Claims serve as the first meaningful release in 2025. The ISM Manufacturing PMI provides an initial indication ahead of Nonfarm Payrolls.
RECOMMENDED LESSONS
Making money in forex is easy if you know how the bankers trade!
Discover how to make money in forex is easy if you know how the bankers trade!
5 Forex News Events You Need To Know
In the fast moving world of currency markets, it is extremely important for new traders to know the list of important forex news...
Top 10 Chart Patterns Every Trader Should Know
Chart patterns are one of the most effective trading tools for a trader. They are pure price-action, and form on the basis of underlying buying and...
7 Ways to Avoid Forex Scams
The forex industry is recently seeing more and more scams. Here are 7 ways to avoid losing your money in such scams: Forex scams are becoming frequent. Michael Greenberg reports on luxurious expenses, including a submarine bought from the money taken from forex traders. Here’s another report of a forex fraud. So, how can we avoid falling in such forex scams?
What Are the 10 Fatal Mistakes Traders Make
Trading is exciting. Trading is hard. Trading is extremely hard. Some say that it takes more than 10,000 hours to master. Others believe that trading is the way to quick riches. They might be both wrong. What is important to know that no matter how experienced you are, mistakes will be part of the trading process.

Best Forex Brokers with Low Spreads
VERIFIED Low spreads are crucial for reducing trading costs. Explore top Forex brokers offering competitive spreads and high leverage. Compare options for EUR/USD, GBP/USD, USD/JPY, and Gold.