Technical Confluences Detector
What is the Technical Confluences Detector?
The FXS Technical Confluences Detector is an in-house tool, developed by FXStreet experts, that allows you to identify those price levels where congestion of indicators like moving averages, Fibonacci levels, Pivot Points occurs. Knowing where these congestion points are located is very helpful as it allows the trader to see these areas of support and resistance easily.
This tool is customizable so you can choose the asset selectors and the time frame that are more suitable for your trading operations.
Read more about the Technical Confluences Detector.

Gold kicks off 2025 on the front foot Premium
Gold price is trading on the front foot, kicking off 2025 on Thursday. Gold buyers appear defiant amidst a broad-based US Dollar (USD) strength, targeting $2,650 on an extended rebound from the $2,600 key level.
Gold price sees a positive 2025 start
The USD benefits from a risk-averse market environment as investors remain wary of the upcoming policies from US President-elect Donald Trump and the US Federal Reserve’s (Fed) next policy action.
Best brokers in your location
Forex
Commodities
Cryptos
What are the Technical Confluences Detector?
HOW DOES IT WORK?
CONFLUENCE OF TECHNICAL LEVELS
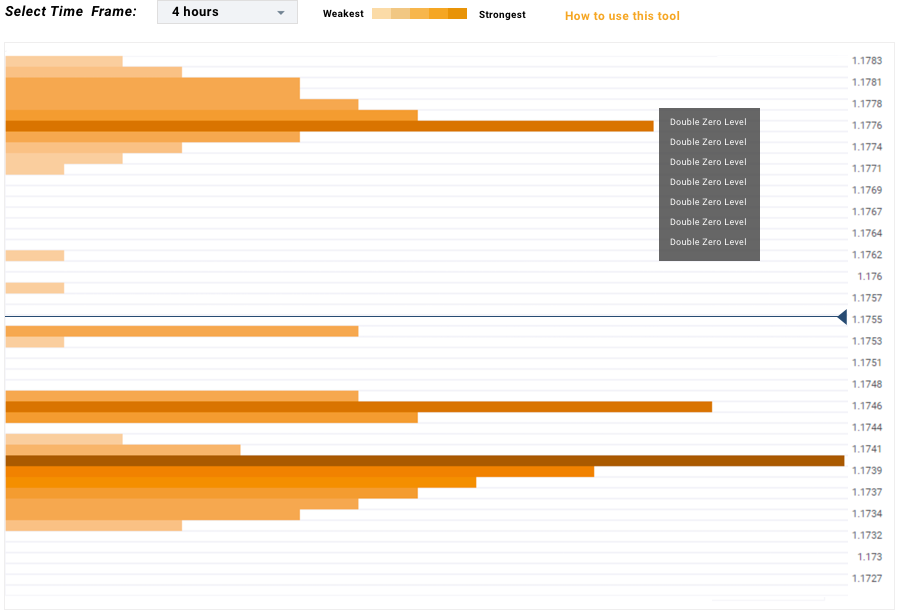
This tool assigns a certain "weight" to each indicator according to its class and time range. This "weight" is propagated to adjacent price levels – even if those levels do not contain any indicator – to highlight the influence of the force of attraction generated by the presence of important indicators such as a simple moving average or a Pivot Point level in a daily range. The algorithm's logical structure intensifies the signal's strength in those areas where several indicators converge – so-called technical confluence zones.
HOW TO READ THE CHART?
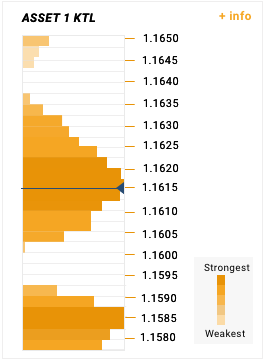
The tool detects and draws the price levels where indicators are placed, highlighting those levels where several indicators converge simultaneously. The length of each bar indicates the intensity of the resistance or support levels generated by the technical indicators. We have also implemented a color gradient to intensify the bars' tonality where the Technical Confluences Detector finds more resistance to price advance. The white lines represent areas where no technical indicator is detected and where the price can move with ease.
TOOLTIP
You can see which indicators are within each price level by placing the cursor over the bar price level. The explanation uses a code that indicates:
- Previous daily, weekly and monthly highs and lows.
- Pivot Points
- Moving averages
- Bollinger bands
- Fibonacci retracements
HOW TO USE IT?
With the FXS Technical Confluences Detector tool, you can quickly locate the areas where the price can find a support or resistance zone and make trading decisions. If you are a short-term trader, you will find entry points for counter-trend strategies and hunt a few points at a time. If you are a medium-to-long-term trader, this tool will allow you to know in advance the price levels where a medium-to-long-term trend may stop and rest, where to unwind positions, or where to increase your position size.