- Bitcoin Cash price finds resistance at the 50-week EMA of around $350, signaling an impending decline.
- On-chain data shows that BCH's OI-Weighted Funding Rate is negative, suggesting a bearish trend.
- A weekly candlestick close above $378 would invalidate the bearish thesis.
Bitcoin Cash (BCH) has faced multiple rejections by the 50-week Exponential Moving Average (EMA) of around $350.2. This week, it experienced a 9% decline to trade at $324.2 on Thursday. On-chain data highlights the continuation of the downward trend as BCH's OI-Weighted Funding Rate is negative.
Bitcoin Cash is set for a downleg if it closes below key support level
Bitcoin Cash's price has faced multiple rejections by the 50-week Exponential Moving Average (EMA) of around $350.2. This week, it experienced a 9% decline to trade at $324.2 on Thursday and is approaching the support zone, which ranges from $299.7 to $280.6. This zone is significant for weekly and monthly support.
If BCH closes below $280.6 and breaks below the ascending trendline (drawn by connecting multiple lows from early June 2023), it could crash 23% to retest the December 11, 2023, weekly low of $210.1.
The weekly chart's Relative Strength Index (RSI) and the Awesome Oscillator (AO) have slipped below their respective neutral levels of 50 and zero. This suggests continued momentum favoring bears, potentially leading to a further decline in the Bitcoin Cash price.
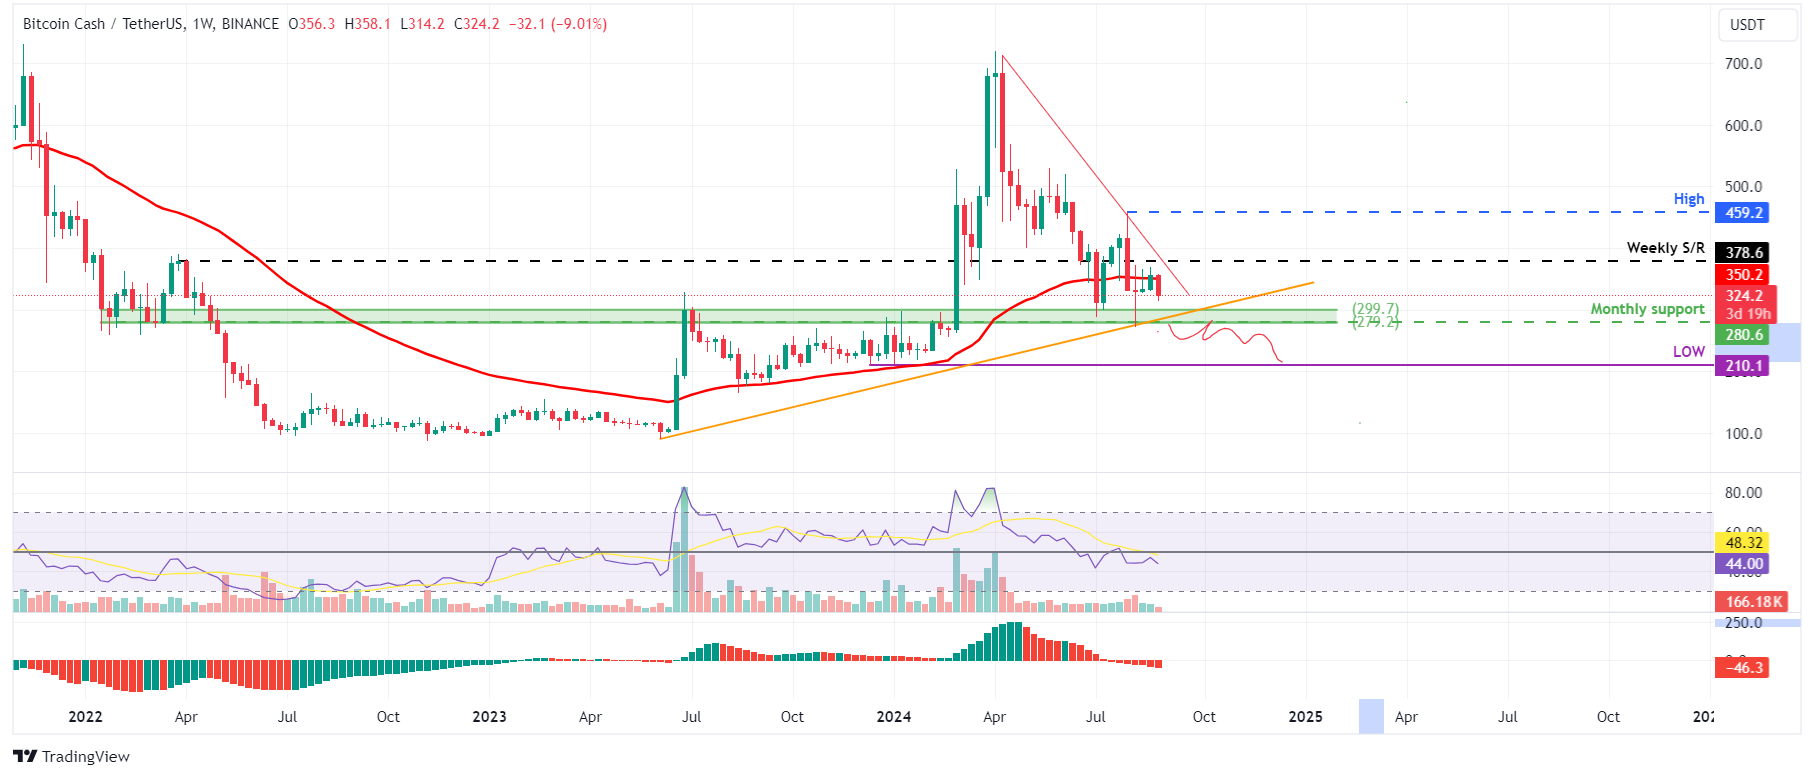
BCH/USDT weekly chart
Coinglass's OI-Weighted Funding Rate data is a crucial metric for traders and analysts to assess market sentiment and predict future price movements. This metric relies on funding rates from futures contracts, weighted by their open interest. A positive rate (longs pay shorts) typically signals bullish sentiment as long positions compensate shorts. Conversely, a negative rate (shorts pay longs) indicates bearish sentiment, with shorts compensating longs.
In BCH's case, this metric stands at -0.026%, reflecting a negative rate and indicating that shorts pay longs. This scenario often signifies bearish sentiment in the market, suggesting potential downward pressure on Bitcoin Cash's price.
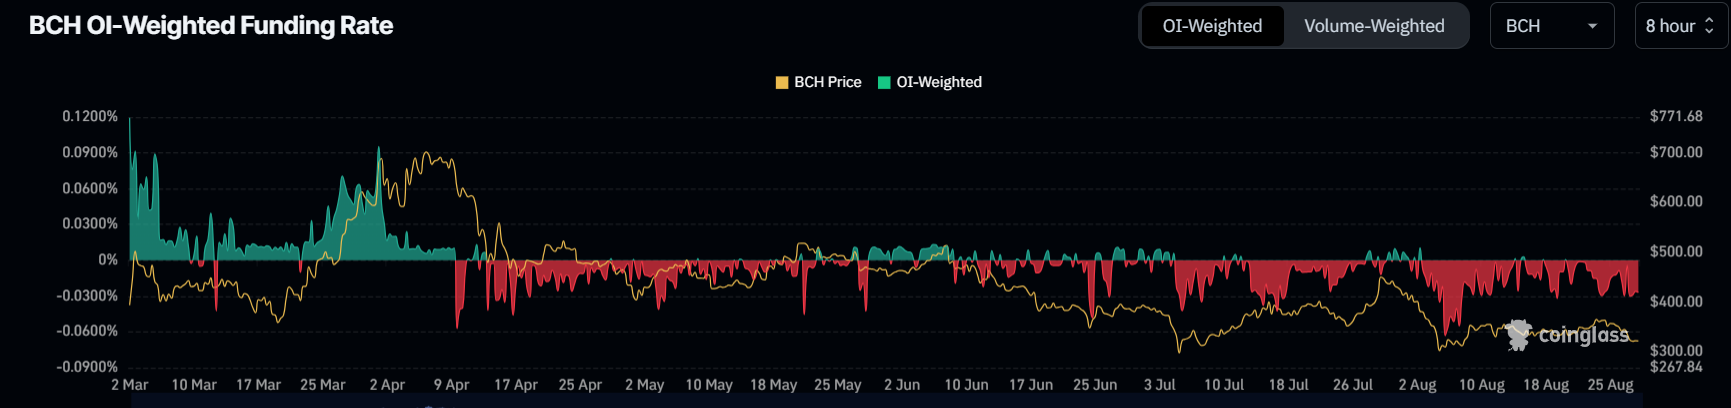
BCH OI-Weighted Funding Rate chart
However, if BCH breaks above the 50-week EMA and closes above the $378 weekly resistance level, it could indicate that bullish sentiment could still make a comeback. Such a development could trigger a 19% rally in Bitcoin Cash's price to revisit its July 29 weekly high of $459.2.
Information on these pages contains forward-looking statements that involve risks and uncertainties. Markets and instruments profiled on this page are for informational purposes only and should not in any way come across as a recommendation to buy or sell in these assets. You should do your own thorough research before making any investment decisions. FXStreet does not in any way guarantee that this information is free from mistakes, errors, or material misstatements. It also does not guarantee that this information is of a timely nature. Investing in Open Markets involves a great deal of risk, including the loss of all or a portion of your investment, as well as emotional distress. All risks, losses and costs associated with investing, including total loss of principal, are your responsibility. The views and opinions expressed in this article are those of the authors and do not necessarily reflect the official policy or position of FXStreet nor its advertisers. The author will not be held responsible for information that is found at the end of links posted on this page.
If not otherwise explicitly mentioned in the body of the article, at the time of writing, the author has no position in any stock mentioned in this article and no business relationship with any company mentioned. The author has not received compensation for writing this article, other than from FXStreet.
FXStreet and the author do not provide personalized recommendations. The author makes no representations as to the accuracy, completeness, or suitability of this information. FXStreet and the author will not be liable for any errors, omissions or any losses, injuries or damages arising from this information and its display or use. Errors and omissions excepted.
The author and FXStreet are not registered investment advisors and nothing in this article is intended to be investment advice.
Recommended Content
Editors’ Picks

Ethereum Price Forecast: ETH could see new all-time high in 2025 as blobs top burn leaderboard
Ethereum is down 1% on Tuesday following a weeklong consolidation of the general crypto market. The top altcoin could be set for a bullish 2025 if blobs continue their recent trend of burning high amounts of ETH.

PEPE Price Prediction: Last-minute $121M whale demand sparks 1,500% 2024 rally
PEPE price surged 25% within the last 24 hours, decoupling from the broader crypto market’s year-end volatility. With whales spotted entering last-minute buying frenzy, can PEPE breach the $0.000025 resistance?
XRP volumes zoom ahead of Bitcoin, Dogecoin in South Korea, what’s next?
XRP trading volumes on South Korea's biggest crypto exchanges have overtaken those of Bitcoin (BTC) and Ether (ETH) in a sign of flurried interest that often precedes price volatility.
Only three out of ten top altcoins grew in December
The cryptocurrency market continues to fall, losing some of its significant growth since the beginning of the year. Its capitalisation fell a further 1.4% to $3.23 trillion, matching the lows of the last week and a half.

Bitcoin: 2025 outlook brightens on expectations of US pro-crypto policy
Bitcoin price has surged more than 140% in 2024, reaching the $100K milestone in early December. The rally was driven by the launch of Bitcoin Spot ETFs in January and the reduced supply following the fourth halving event in April.

Best Forex Brokers with Low Spreads
VERIFIED Low spreads are crucial for reducing trading costs. Explore top Forex brokers offering competitive spreads and high leverage. Compare options for EUR/USD, GBP/USD, USD/JPY, and Gold.