![]() Andre Gratian
Andre Gratian
Market Turning Points
Point & Figure Overview of SPX
Intermediate trend: 2930 was exceeded by 20 points. Rally top? We need a congestion pattern to establish next count.
Important Cycles
Next 80-day cycle due ~6/08
Market Analysis (Charts courtesy of QChart)
SPX-IWM weekly charts
Last week, SPX reached a little beyond its projected target of 2930 and reversed sharply, closing near its low of the week. IWM rallied as well, tried to close an open gap but failed; it also closed near the low of the week. Next week’s action could be significant because more selling pressure is expected from a bottoming short-term cycle as well as from negative economic reports.
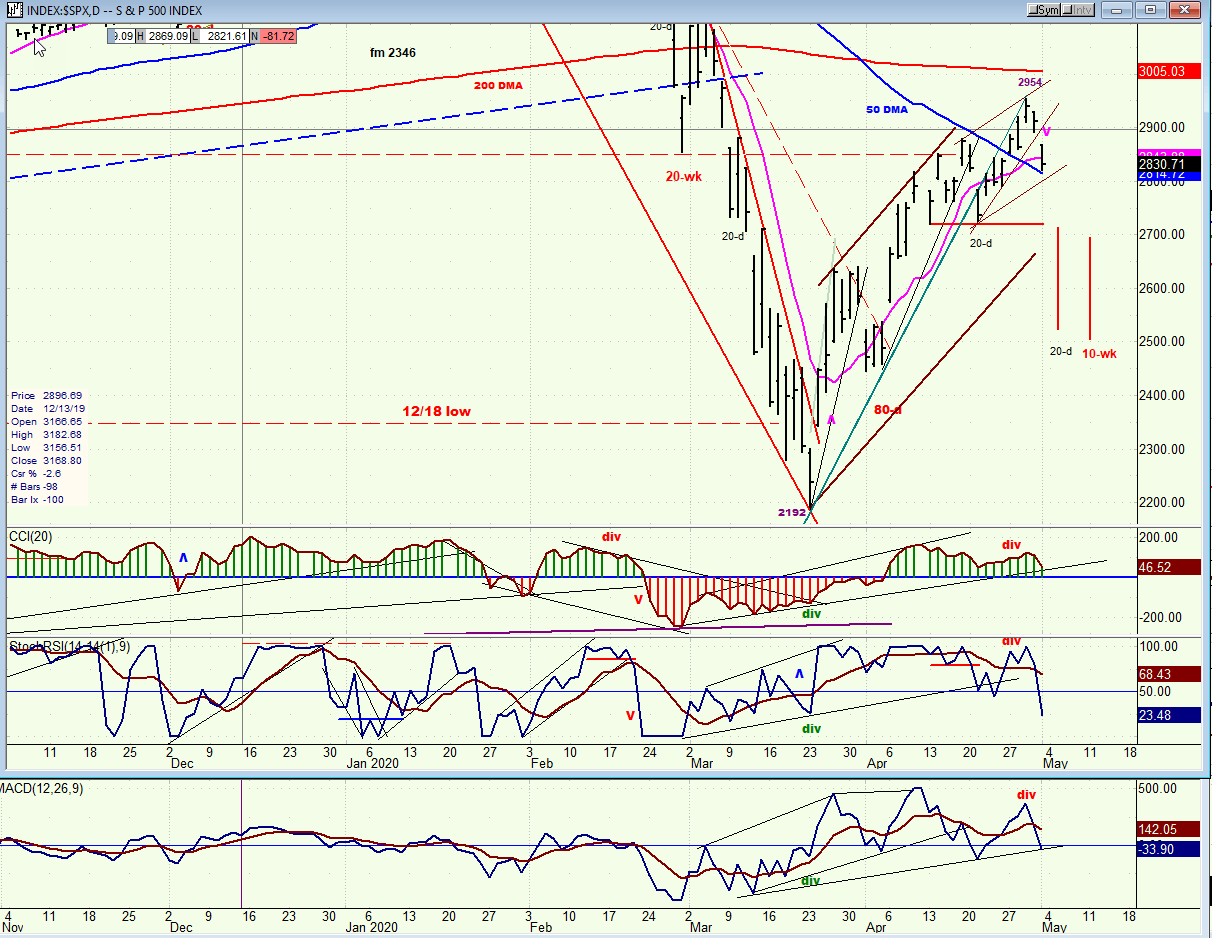
SPX daily chart
SPX surpassed its 2930 projection by 20 points before reversing and plunging 134 points in the next two days. The index closed near its low on Friday, suggesting that the decline is probably not over, especially since the cycle low is ideally due in the middle of next week.
This reversal most likely puts an end to the 763-point bear market rally from mid-March and signals the start of the next phase of the downtrend which started from 3393. It is possible that after additional selling into next week, we could rally into about mid-May before the next reversal.
So far, the decline in prices has only created a strong sell signal in the hourly indicators. But of the daily indicators, only the SRSI has turned negative while the A-Ds are close to doing the same. If there is enough additional weakness CCI will join the other two under the zero line and we will have a confirmed intermediate sell signal.
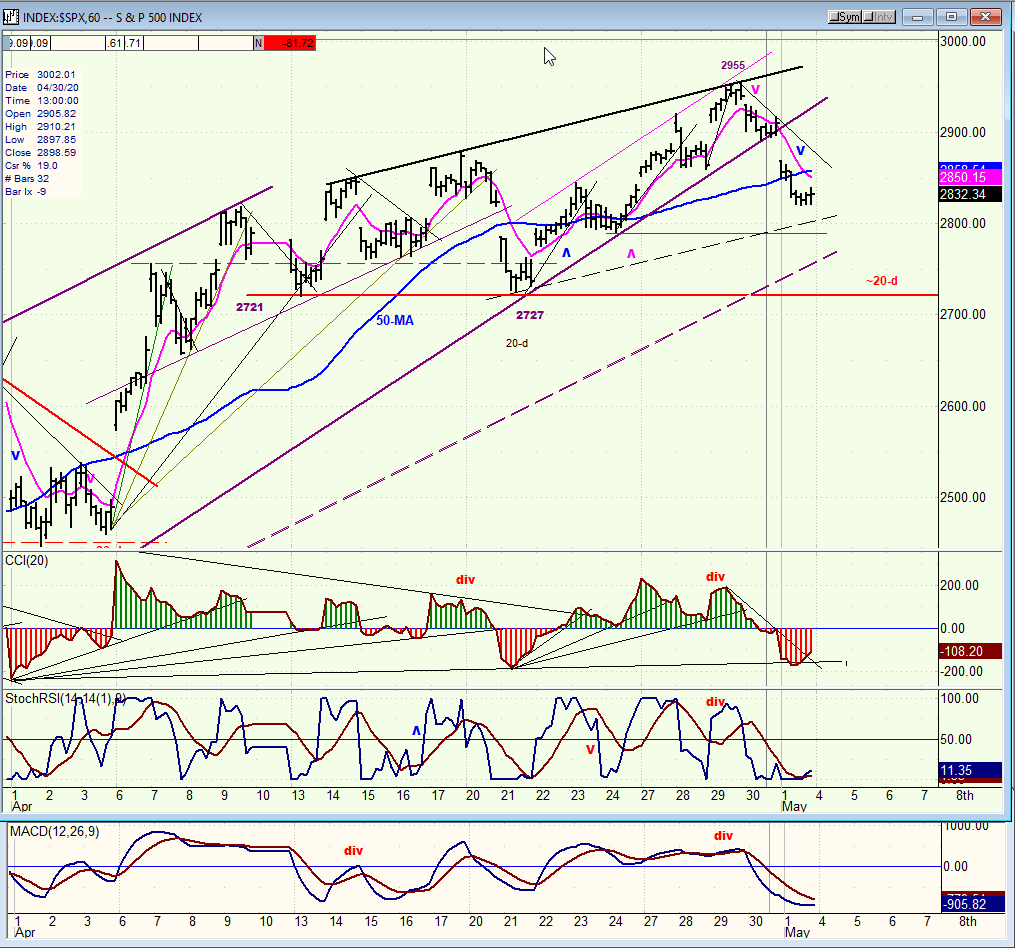
SPX hourly chart
The decline from 2955 occurred without any significant bounce going into Friday’s close. I have marked on the chart the ideal time frame when the minor cycle should make its low, but a reversal could be short-lived.
Note that the decline took the index below the 50-hr MA in one fell swoop, thus creating a strong sell signal in all three oscillators. A return to bullishness would require that the oscillators move back to positive, usually with at least a trace of positive divergence making its appearance first. Since there is none, another two or three days down into the cycle low (and probably beyond) can reasonably be expected.
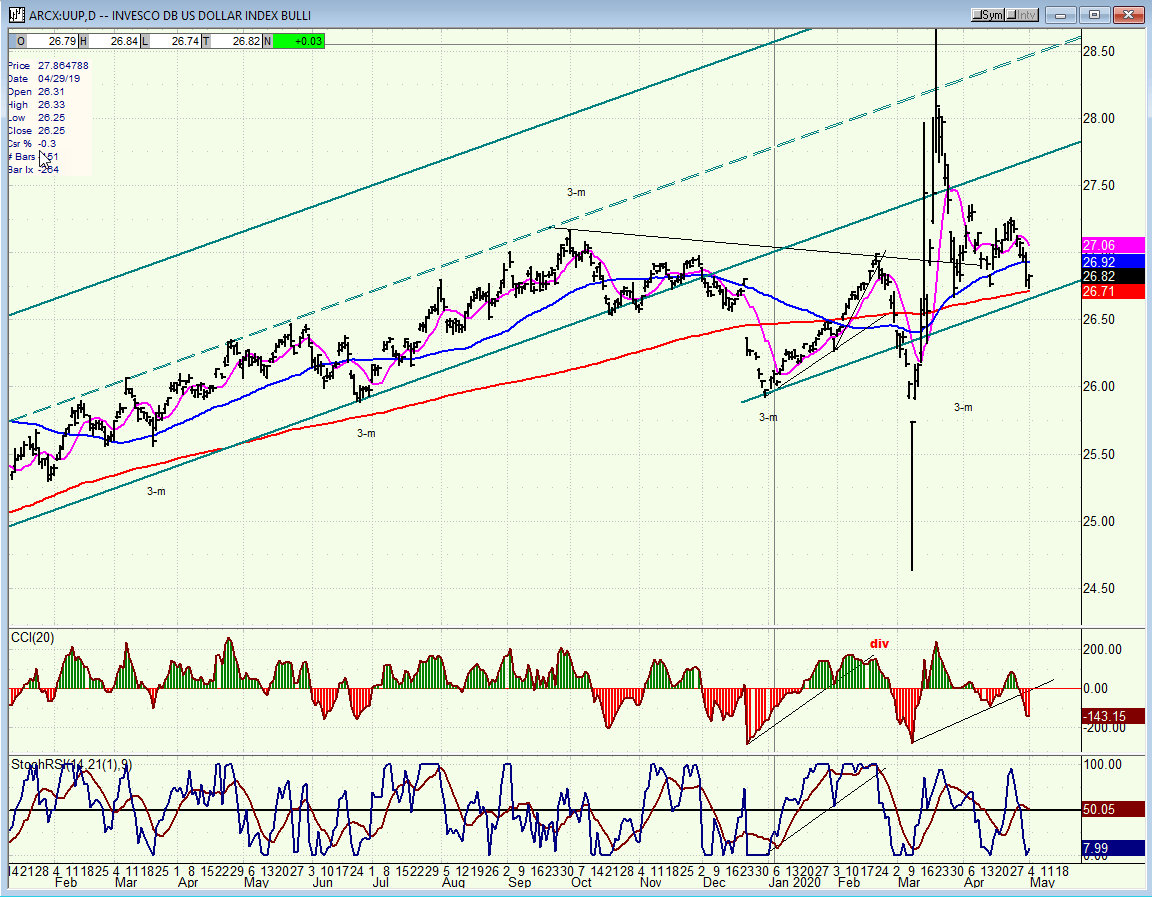
UUP (dollar ETF) daily
UUP has established a trading range above its 200-dma. Friday’s decline has taken it back down to it once again, and UUP must hold at this level or risk rolling over into the next 3-m low which does not come until the end of June.
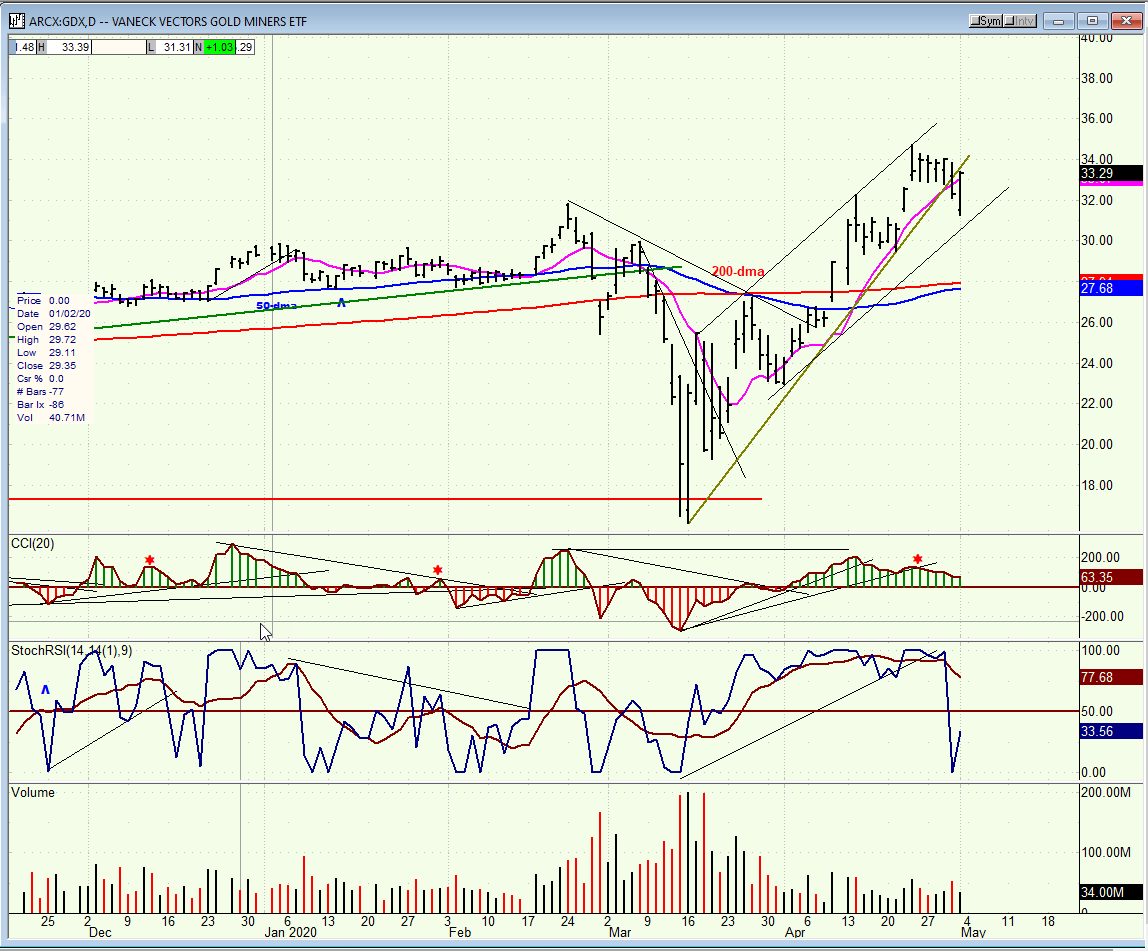
GDX (Gold miners ETF) daily
GDX needs to continue to rebound above 34, or risk correcting down to 28.50.
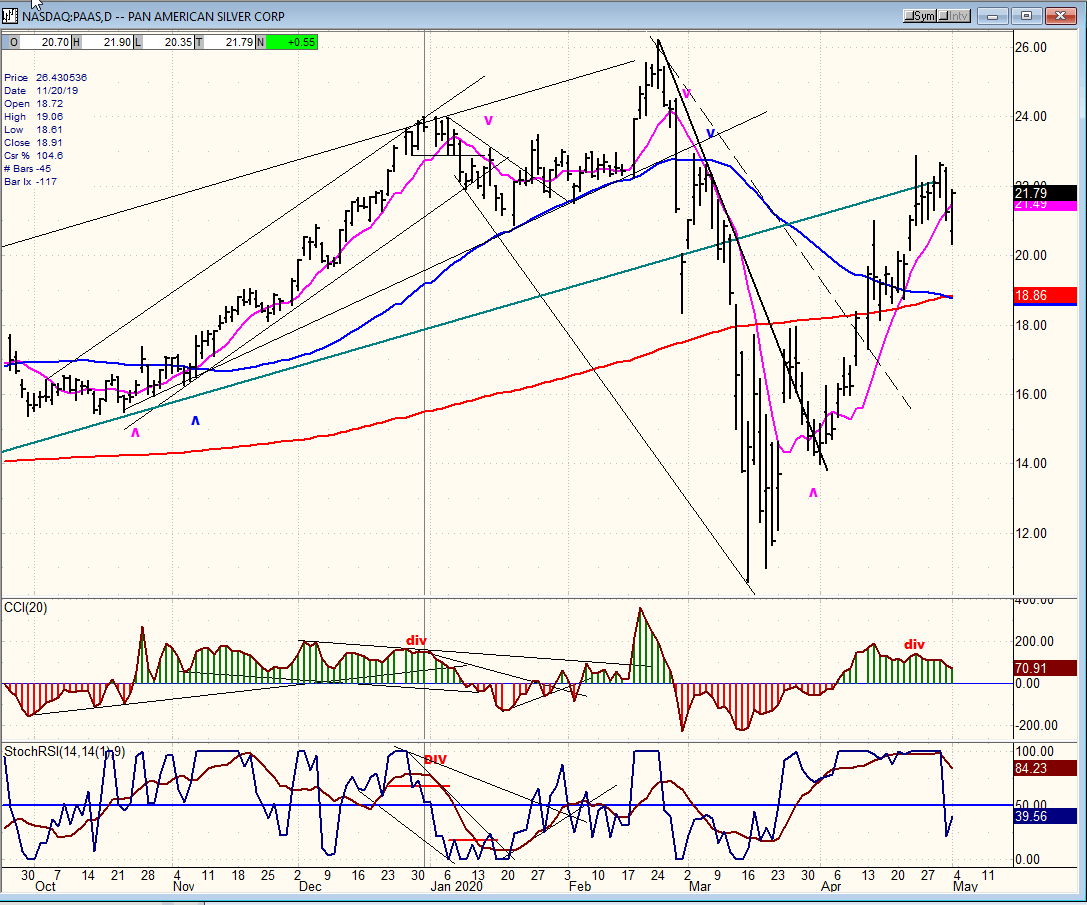
PASS (Pan American Silver Corp.) daily
PAAS continues to model its trading after GDX. It’s in the same fix!
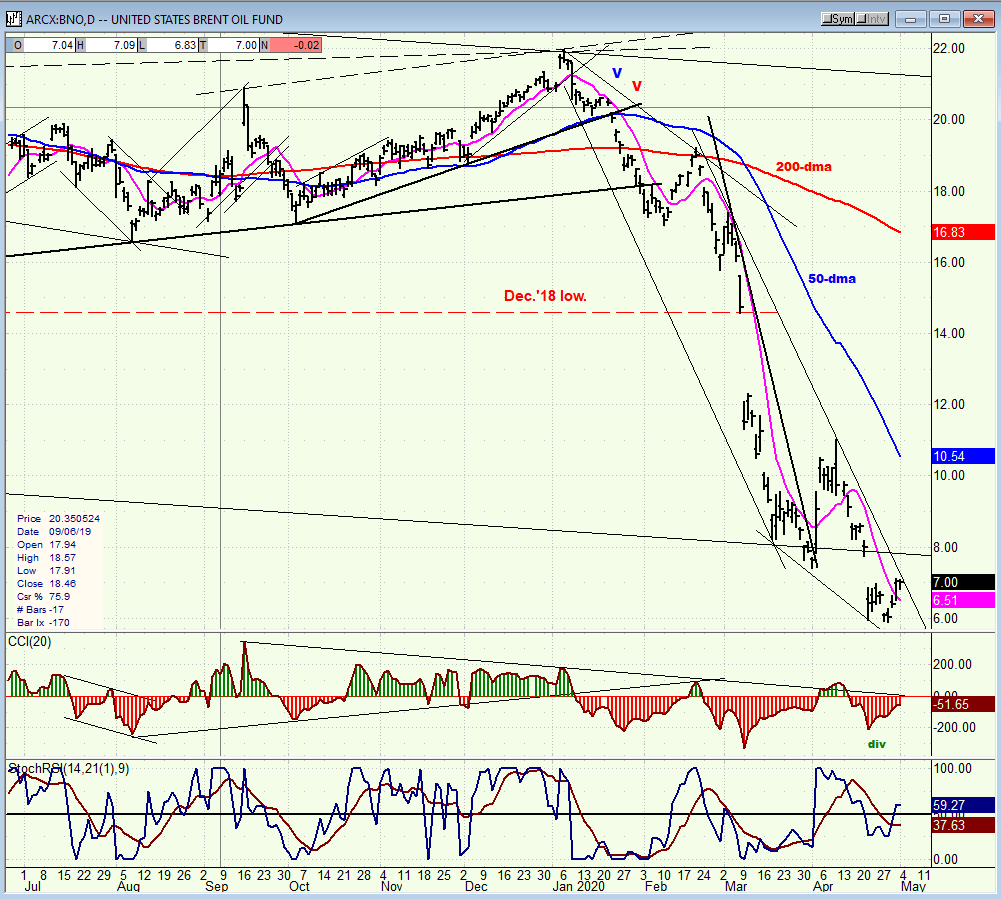
BNO (U.S. Brent oil fund) daily
BNO may be starting a base between 6 and 8.
Summary
The ISM non-manufacturing PMI is due on Tuesday morning, and this could be a good time for a near-term cycle low. However, a rebound could be short-lived, since next Friday investors will have to face some extremely poor job numbers.
The comments made in the daily updates and the Market Summary about the financial markets are based purely on what I consider to be sound technical analysis principles. They represent my own opinion and are not meant to be construed as trading or investment advice, but are offered as an analytical point of view which might be of interest to those who follow stock market cycles and technical analysis.
Recommended Content
Editors’ Picks

EUR/USD extends slide toward 1.0300, touches new two-year low
EUR/USD stays under bearish pressure and trades at its lowest level since December 2022 below 1.0350 on Thursday. The pair turned south amid a resurgent US Dollar demand and worsening market mood. Investors stay cautious at the onset of 2025, awaiting the US jobs data for fresh incentives.

GBP/USD slumps to multi-month lows below 1.2450
Following an earlier recovery attempt, GBP/USD reversed its direction and declined to its weakest level in nearly eight months below 1.2450. The renewed US Dollar (USD) strength on worsening risk mood weighs on the pair as markets await mid-tier data releases.

Gold benefits from risk aversion, climbs above $2,640
Gold gathers recovery momentum and trades at a two-week-high above $2,640 heading into the American session on Thursday. The precious metal benefits from the sour market mood and the pullback seen in the US Treasury bond yields.

XRP rockets 11% as Bitcoin starts New Year with bullish bang
Crypto majors zoomed higher in the past 24 hours as the market entered a widely expected bullish year, with Bitcoin inching above $95,000 to shake off losses from last week. XRP surged 11% to lead growth among majors as of Thursday, led by $1.3 billion worth of trading volumes on Korea-focused exchange UpBit.

Three Fundamentals: Year-end flows, Jobless Claims and ISM Manufacturing PMI stand out Premium
Money managers may adjust their portfolios ahead of the year-end. Weekly US Jobless Claims serve as the first meaningful release in 2025. The ISM Manufacturing PMI provides an initial indication ahead of Nonfarm Payrolls.

Best Forex Brokers with Low Spreads
VERIFIED Low spreads are crucial for reducing trading costs. Explore top Forex brokers offering competitive spreads and high leverage. Compare options for EUR/USD, GBP/USD, USD/JPY, and Gold.